1.Manual Dashboards : These are usually created using spreadsheets like Google Sheets or Microsoft Excel. Teams track OKRs manually by inputting data and updating it regularly.
- Pros: Low cost, customizable.
- Cons: Time-consuming to update, harder to visualize, prone to human error.
Example Template for Google Sheets/Excel:
| Objective | Key Result Description | Target | Actual | Progress (%) | Status |
|---|---|---|---|---|---|
| Increase brand awareness | Increase website traffic by 20% | 20% | 15% | 75% | Yellow |
| Grow social media followers by 30% | 30% | 22% | 73% | Yellow | |
| Increase email open rate by 10% | 10% | 5% | 50% | Red |
Table 4 3: Manual OKR Dashboard
2.Automated Dashboards: These dashboards use specialized OKR software tools like Gtmhub, Weekdone, 15Five, Vabro or Jira to automate the tracking process. These tools often provide real-time updates and advanced reporting features.
- Pros: Automated, visually rich, real-time updates, integration with other tools.
- Cons: Costly, requires learning curve for team members.
- Vabro: Provides a customizable dashboard that helps organizations streamline goal-setting, track progress, and improve team alignment through real-time progress visualization, workspace integration, automated updates, and collaboration features.
Figure 4.22 shows Vabro’s OKR dashboard:
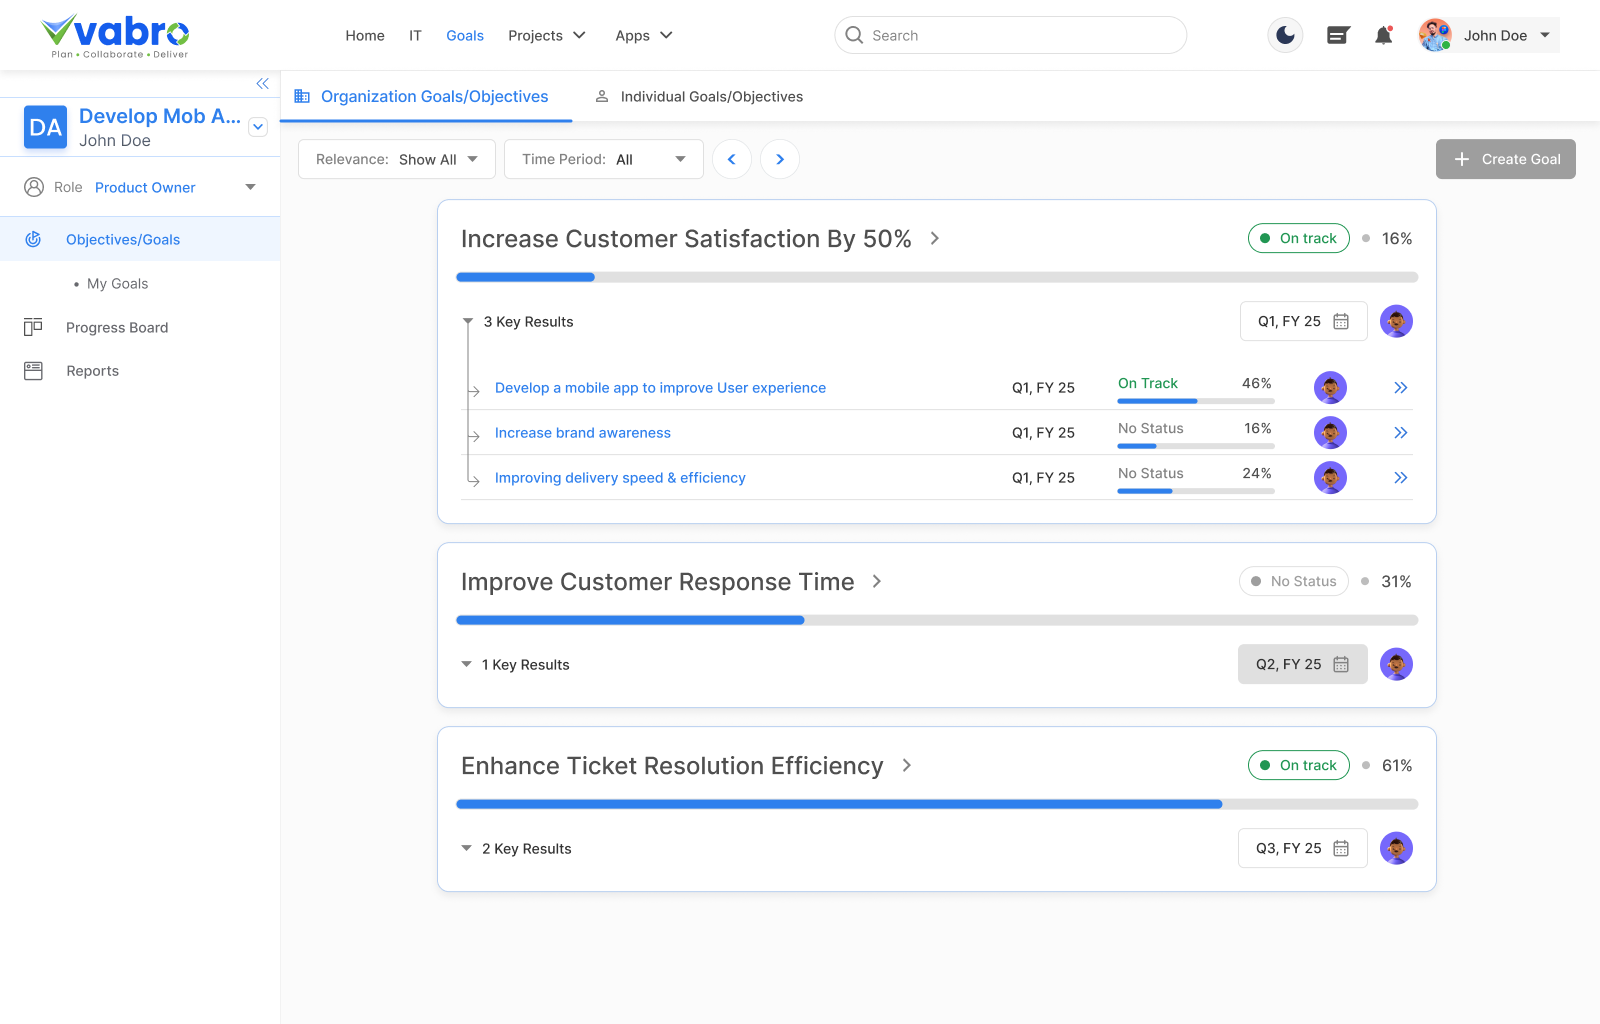
Figure 4.22: OKR Dashboard (Source: Vabro)
Figure 4.22 above showcases the Vabro OKR dashboard, displaying goal tracking, progress visualization, attachments, comments, and key result creation, enabling organizations to monitor and achieve objectives efficiently with real-time collaboration and updates.
- Gtmhub: Provides a user-friendly, customizable dashboard with real-time tracking of OKRs.
- Weekdone: Visualizes OKRs with detailed progress reports and performance metrics.
- 15Five: Offers a weekly check-in tool that integrates with OKRs and team progress.
- WorkBoard: Offers features for tracking both OKRs and performance outcomes, often used by larger teams.
Figure 4.23 shows WorkBoard dashboard:
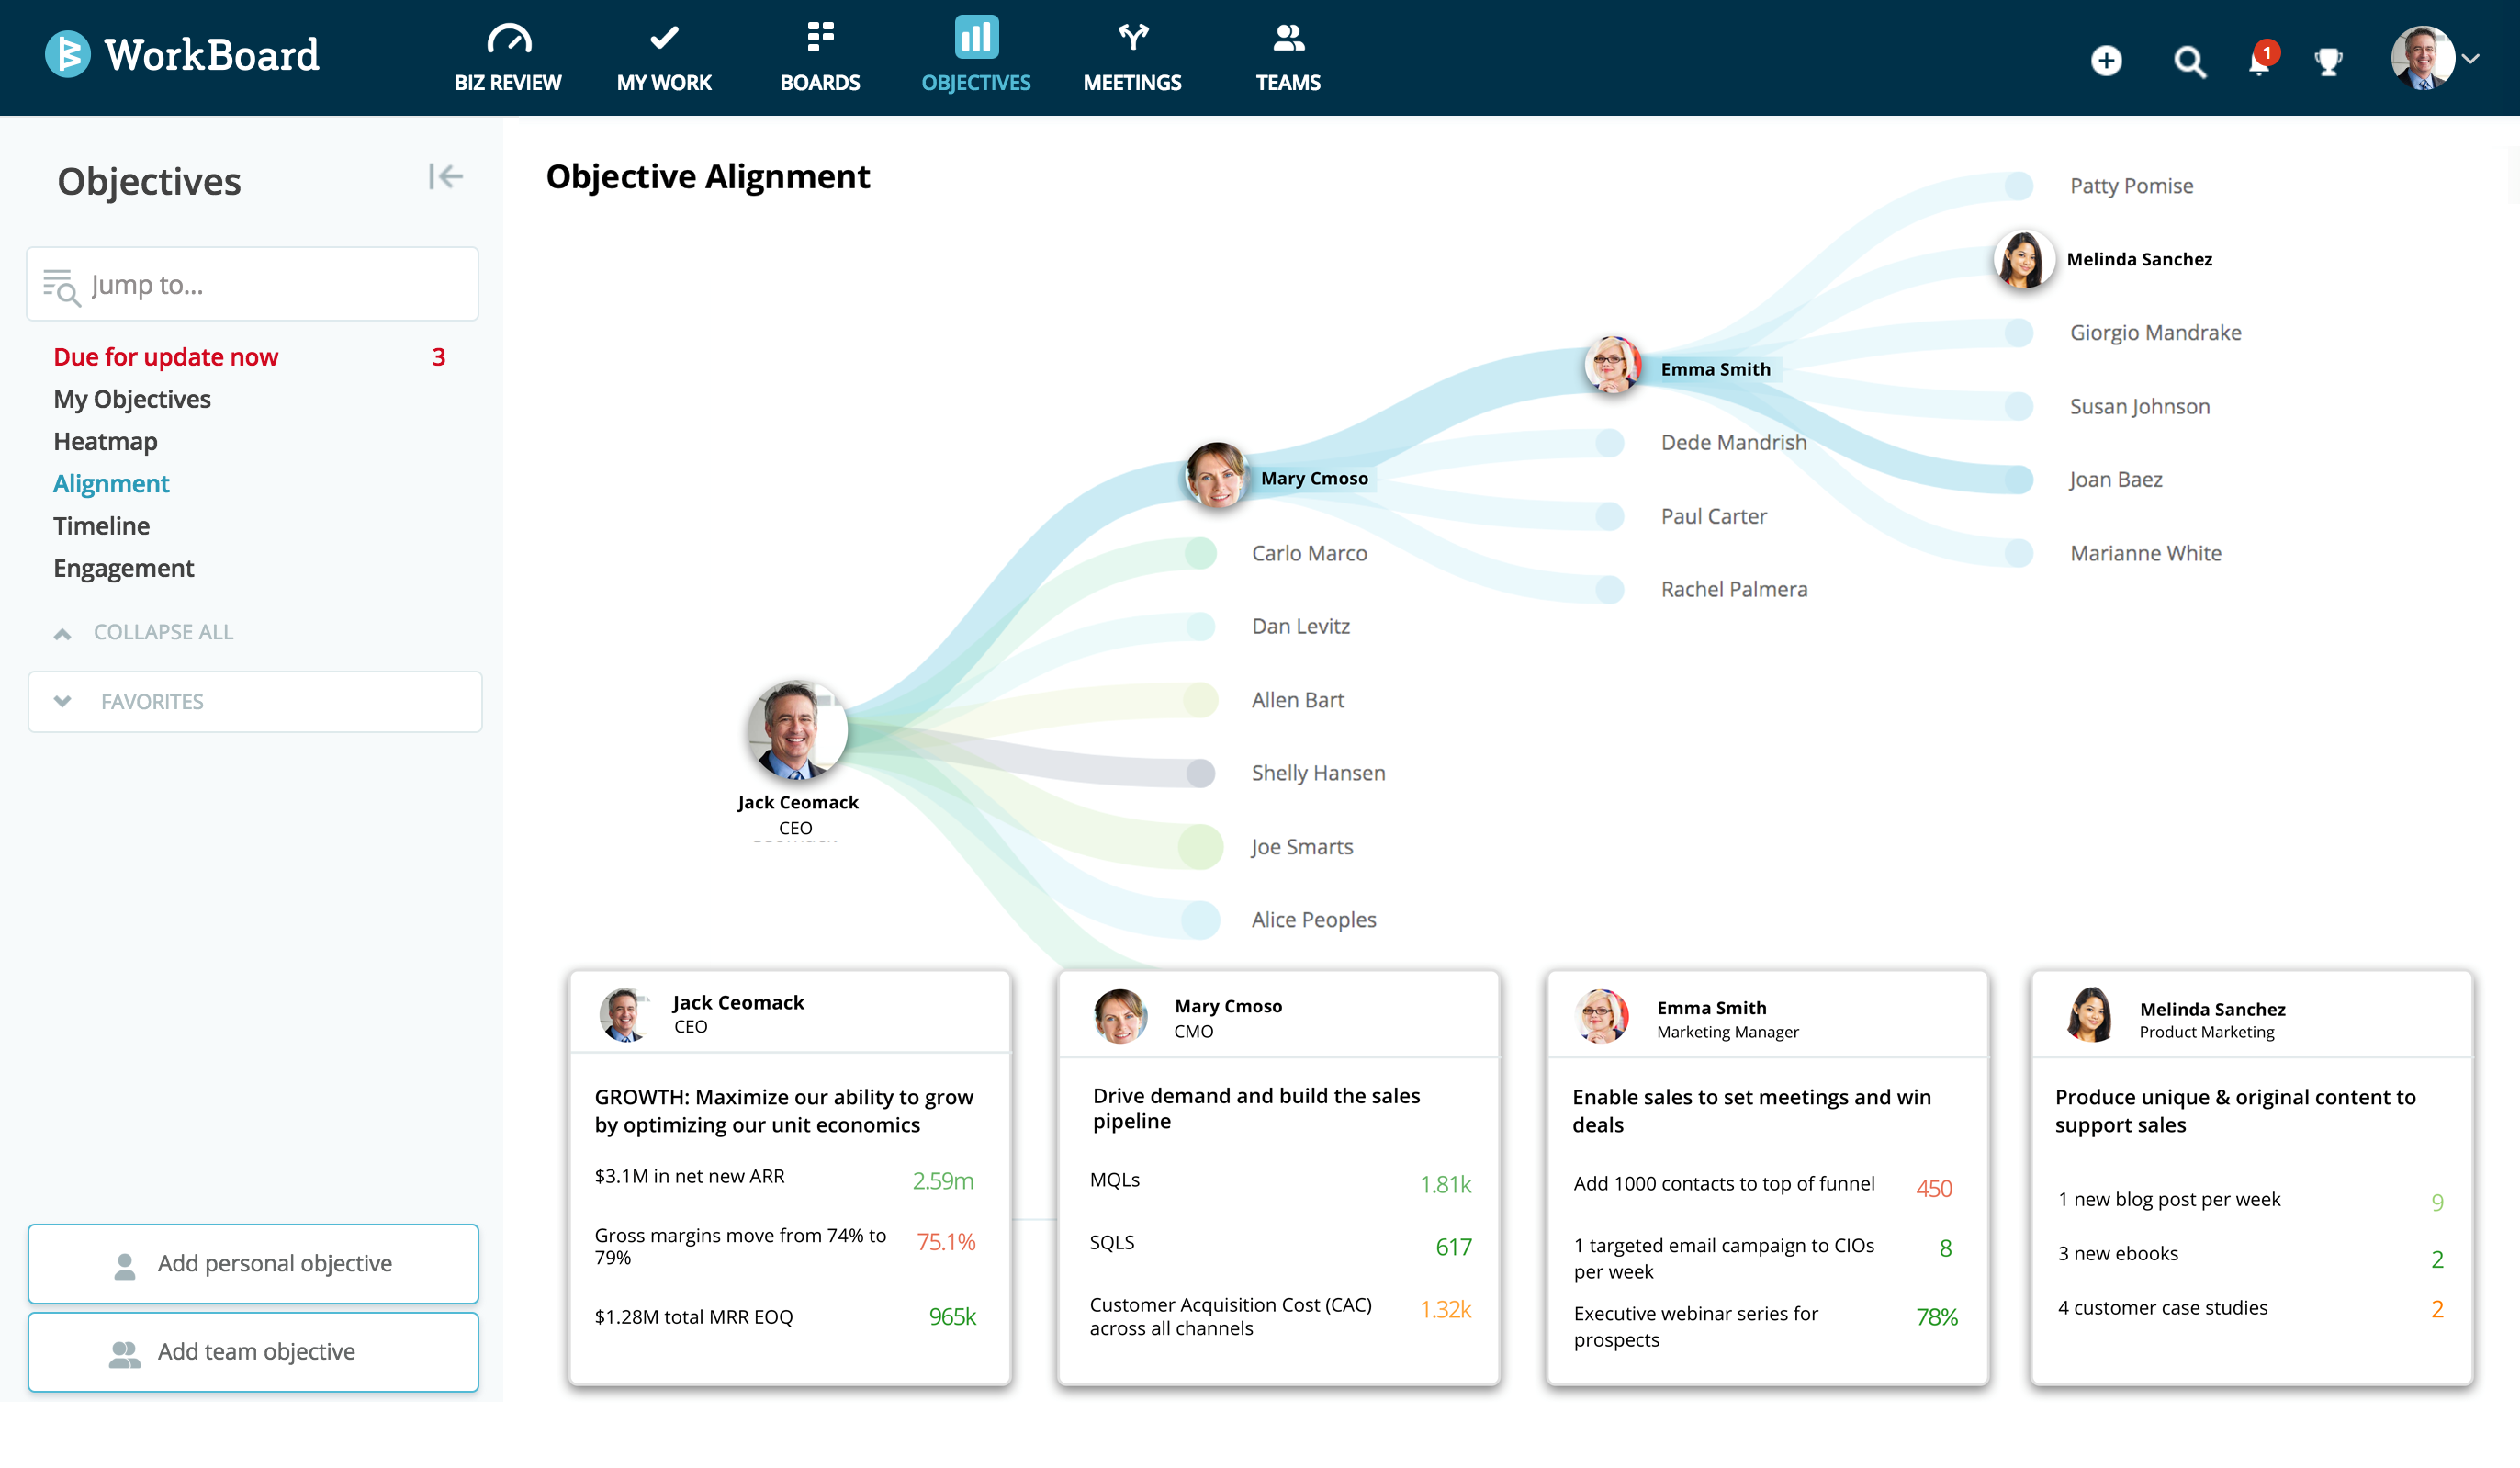
Figure 4.23: OKR Dashboard (Source: WorkBoard)
Figure 4.23 above shows WorkBoard’s OKR dashboard, visualizing goal dependencies, team objectives, progress tracking, and performance metrics for streamlined strategic alignment and execution.
3.Project Management Tools: Many teams also use tools like Vabro, Trello, JOP, Asana, or Monday.com to track OKRs alongside project tasks. These platforms allow teams to break down key results into actionable tasks and track progress toward those tasks in real time.
Figure 4.24 shows a JOP board:
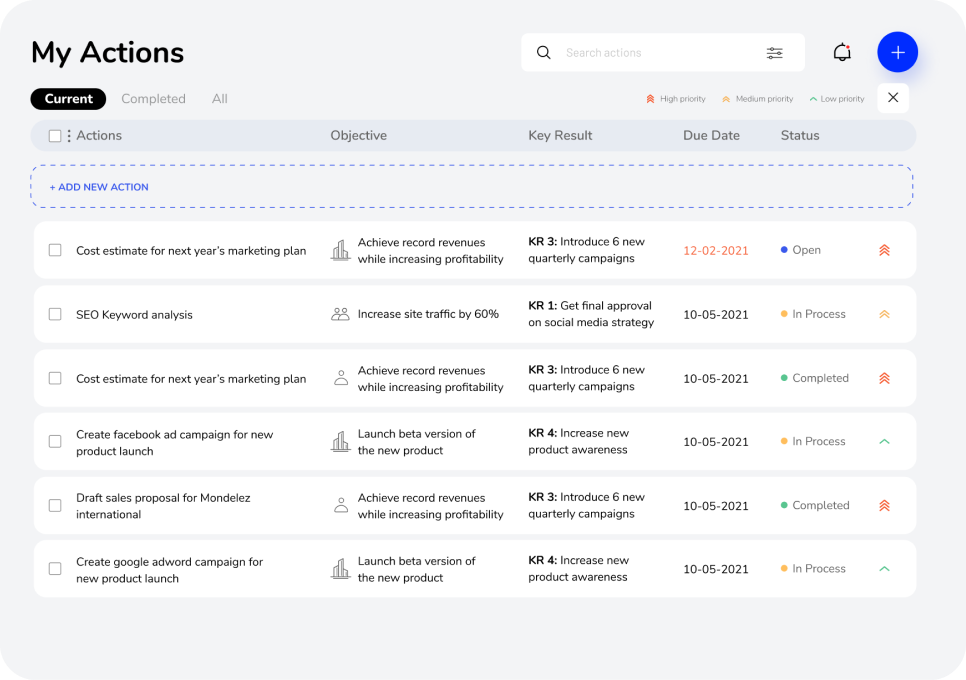
Figure 4.24: JOP Board Tracking Progress (Source: JOP)
Figure 4.24 showcases a JOP board containing Objectives as a list and associated Key Results. Team members can update the status or add comments to track progress.